Occupancy Grid
This section describes the Occupancy Grid, which represents the space of detected objects by dividing it into cell-sized units of fixed dimensions.
Occupancy Grid
Create Occupancy Grid
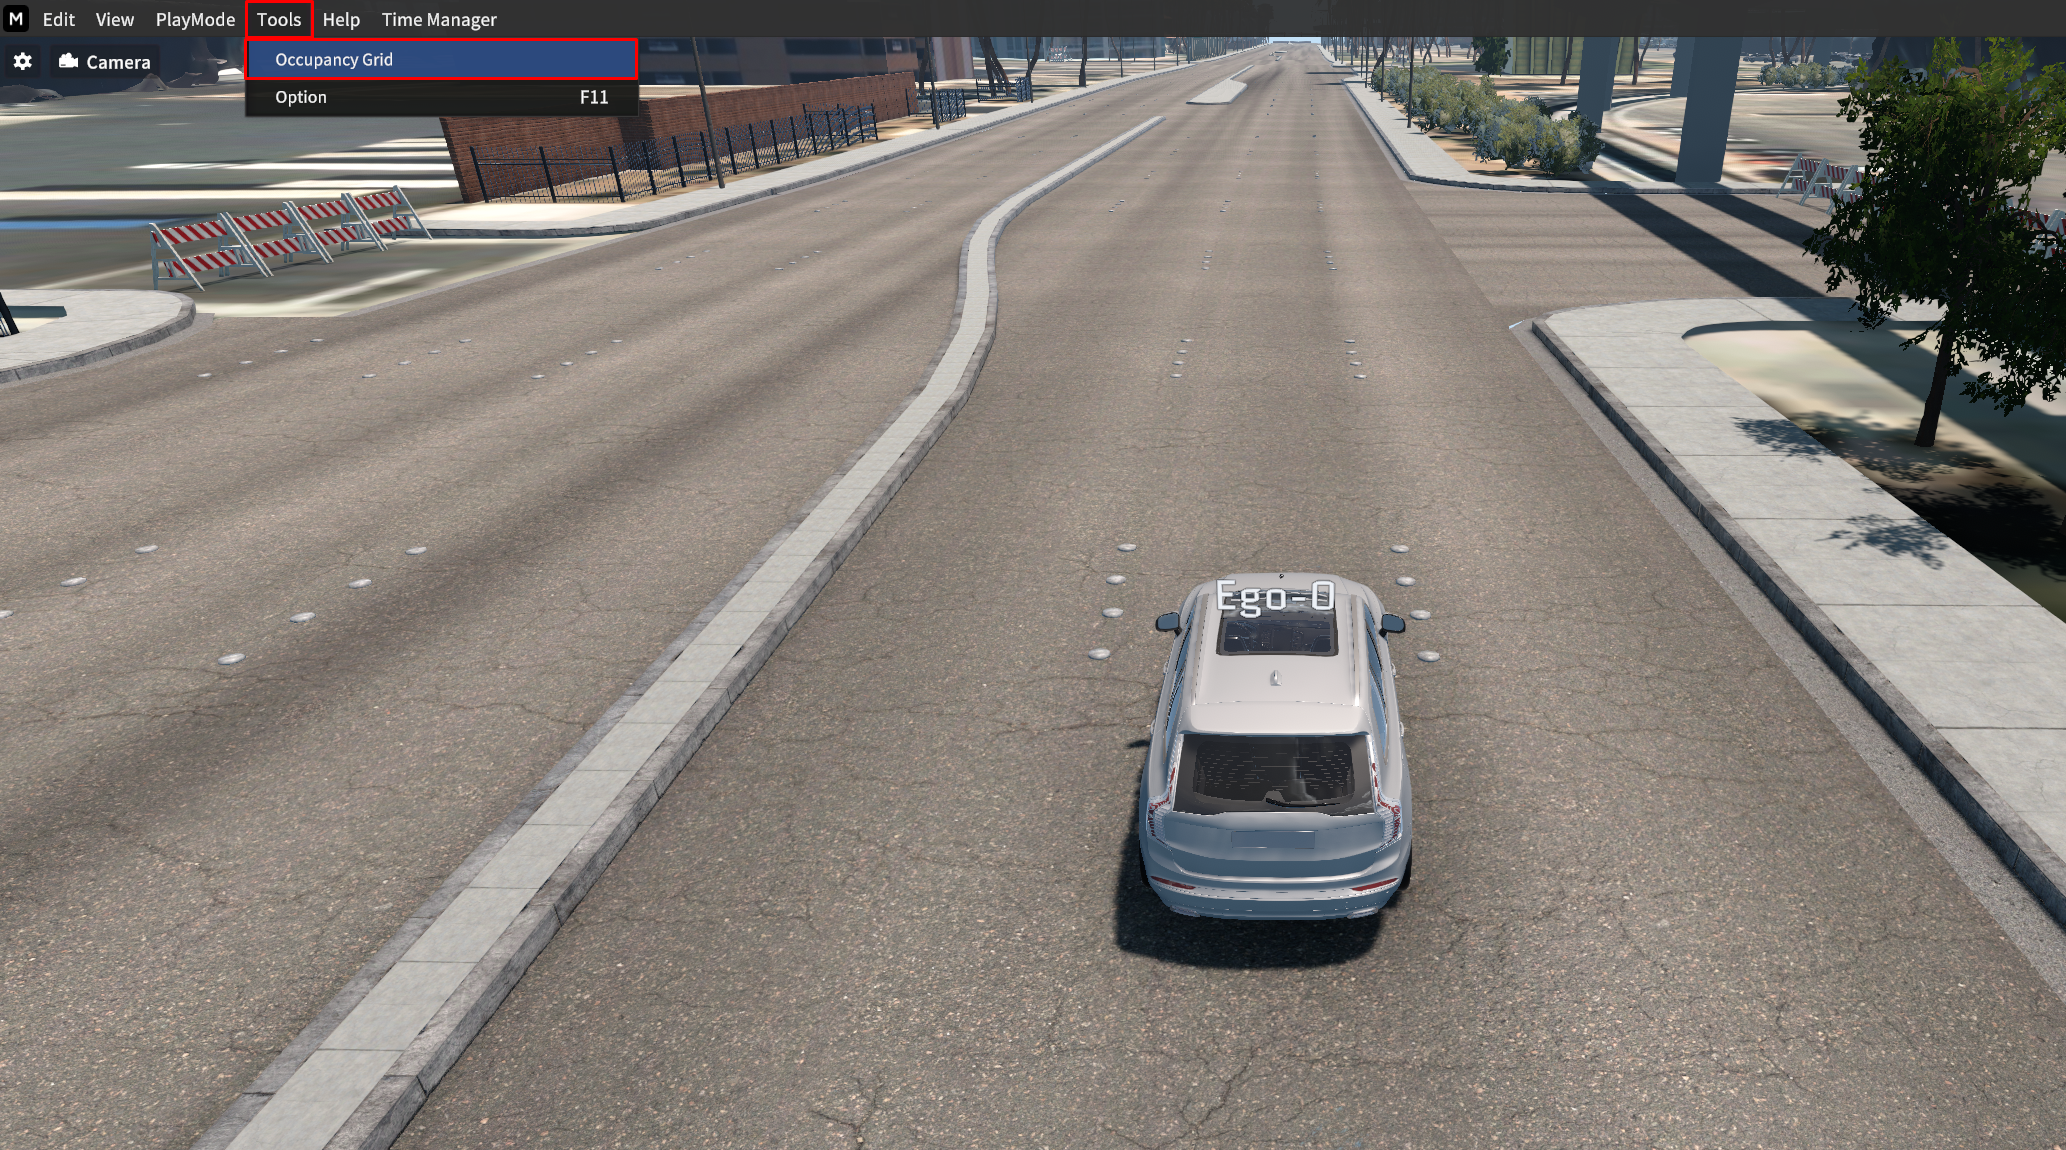
Go to Tools > Occupancy Grid.
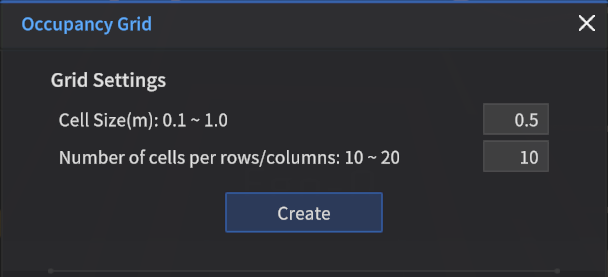
Set the Cell Size and Number of cells per row/column, then click Create.
The terms "Interval" and "Size" in the Occupancy Grid window have been updated as shown below.
Interval → Cell Size
Size → Number of cells per row/column
Grid Settings (m)
Cell Size : Size of one Occupancy Grid cell
Range value: 0.1 ~ 1
Default value: 0.5
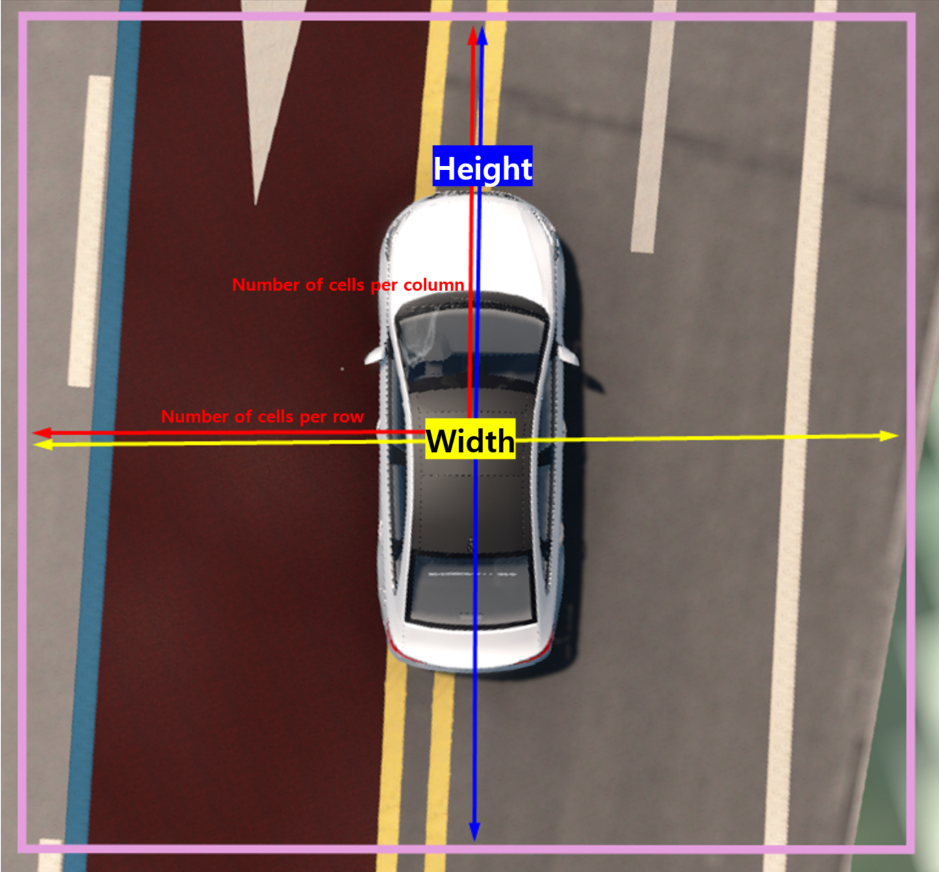
Number of cells per row/column : A total number of Grids from the Ego Vehicle to the distance of the Occupancy Grid boundary
Range value: 10 ~ 20
Default value: 10
Example: When set to 10 cells per row and column, the number of grids doubles to 20.
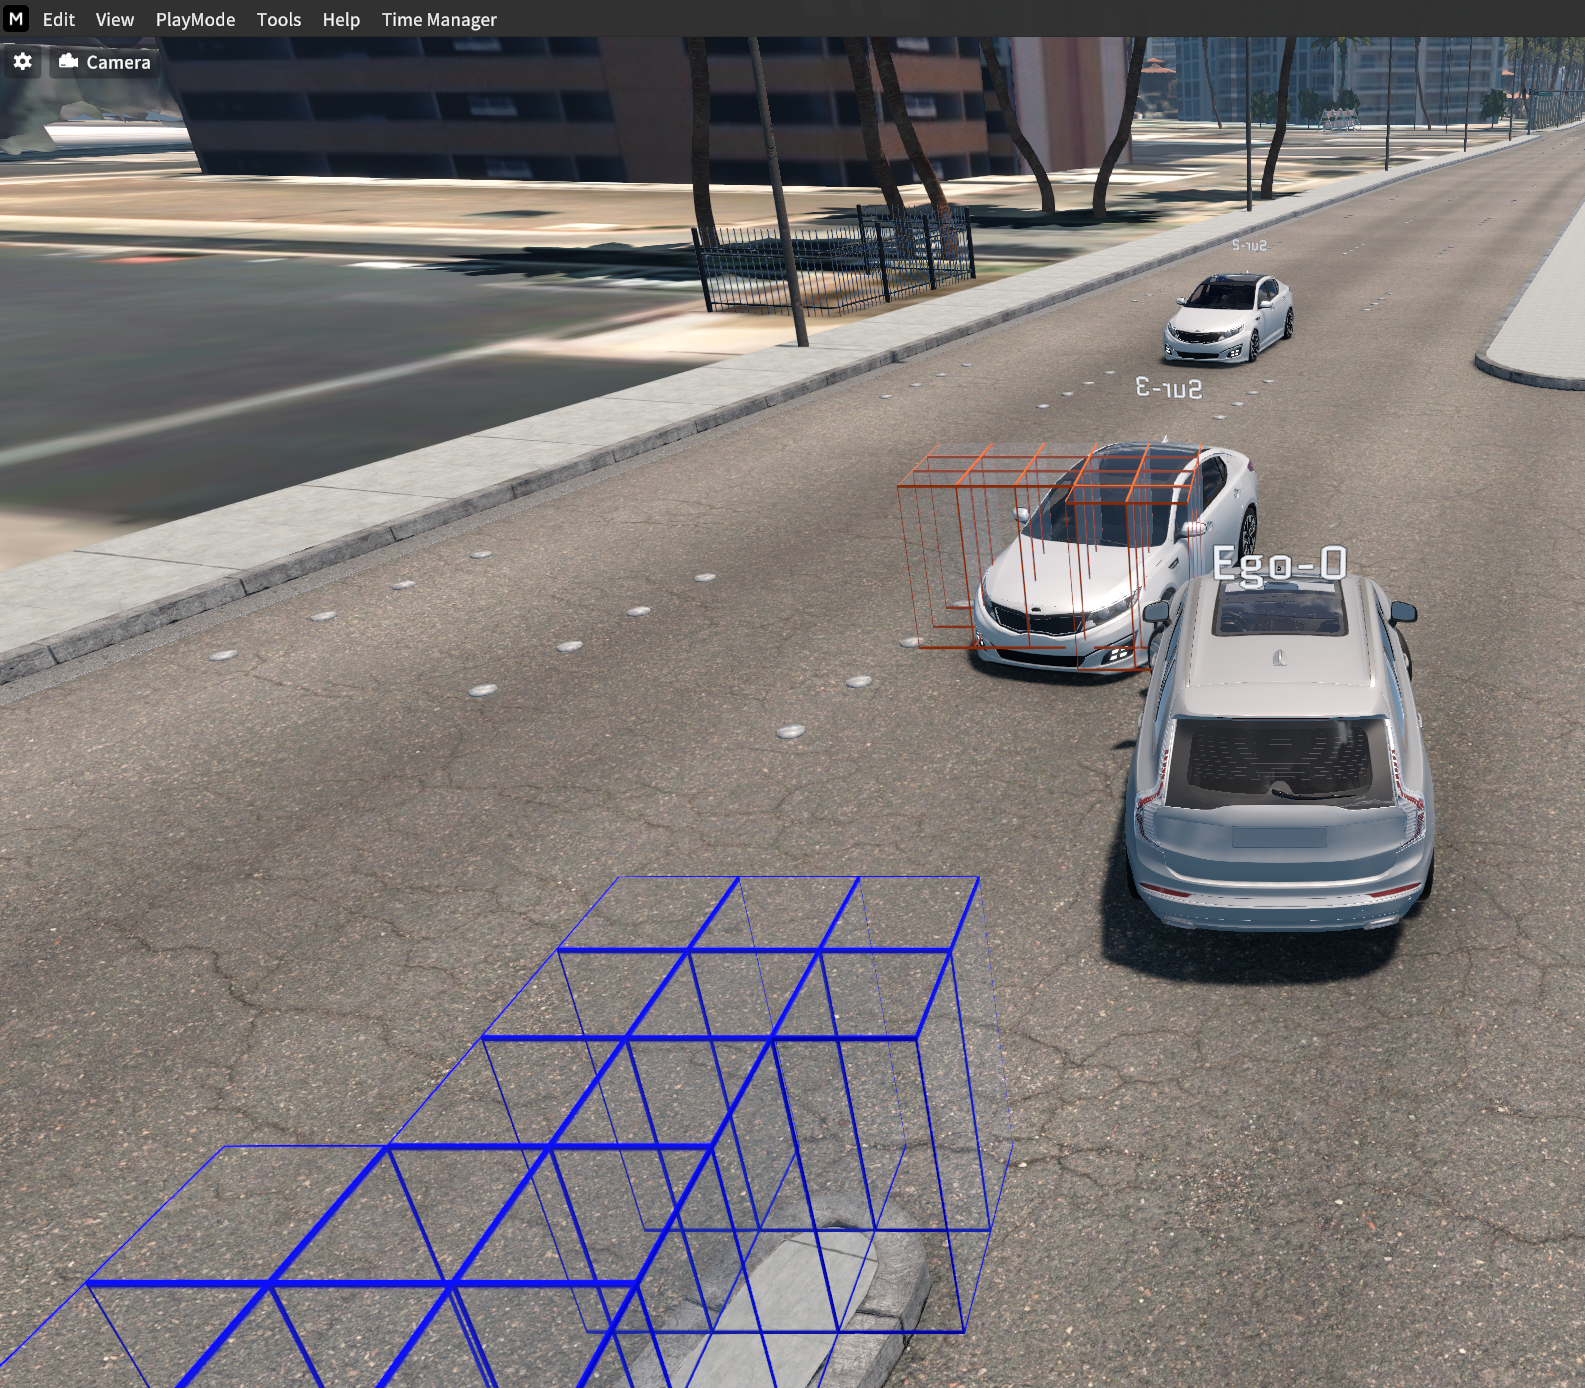
When an object around the Ego-vehicle is detected, its position is recognized in the cube shape.
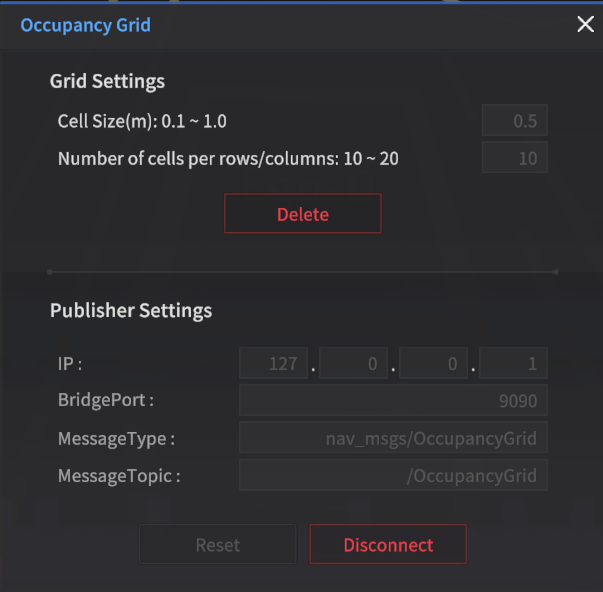
OccupancyGridPublisher
Set IP and Port.
Message Type : nav_msgs/OccupancyGrid
Default Topic : /OccupancyGrid
After configuring the network, clicking Connect will publish a ROS message.
Occupancy Grid ROS Message
Ubuntu ROS Setting
Run ROS bridge
$ roslaunch rosbridge_server rosbridge_websocket.launch
Run RQT
$ rqtConfirm the published data via RQT.
int8[] data : Occupancy Grid data
Pedestrian: 10
Vehicle: 20
Road and Infrastructure: 70
ETC: 100
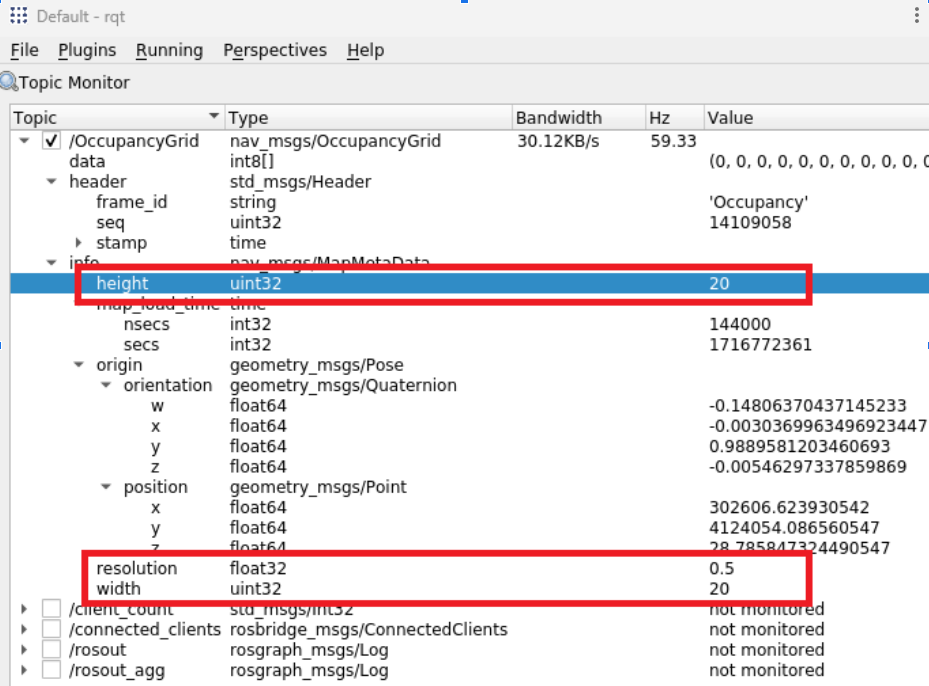
The values of Height and Width are equal to twice the number of cells per row/column.